- HOME
- Sustainability
- Environment
- Concept and Objectives of Environmental Preservation
Concept and Objectives of Environmental Preservation
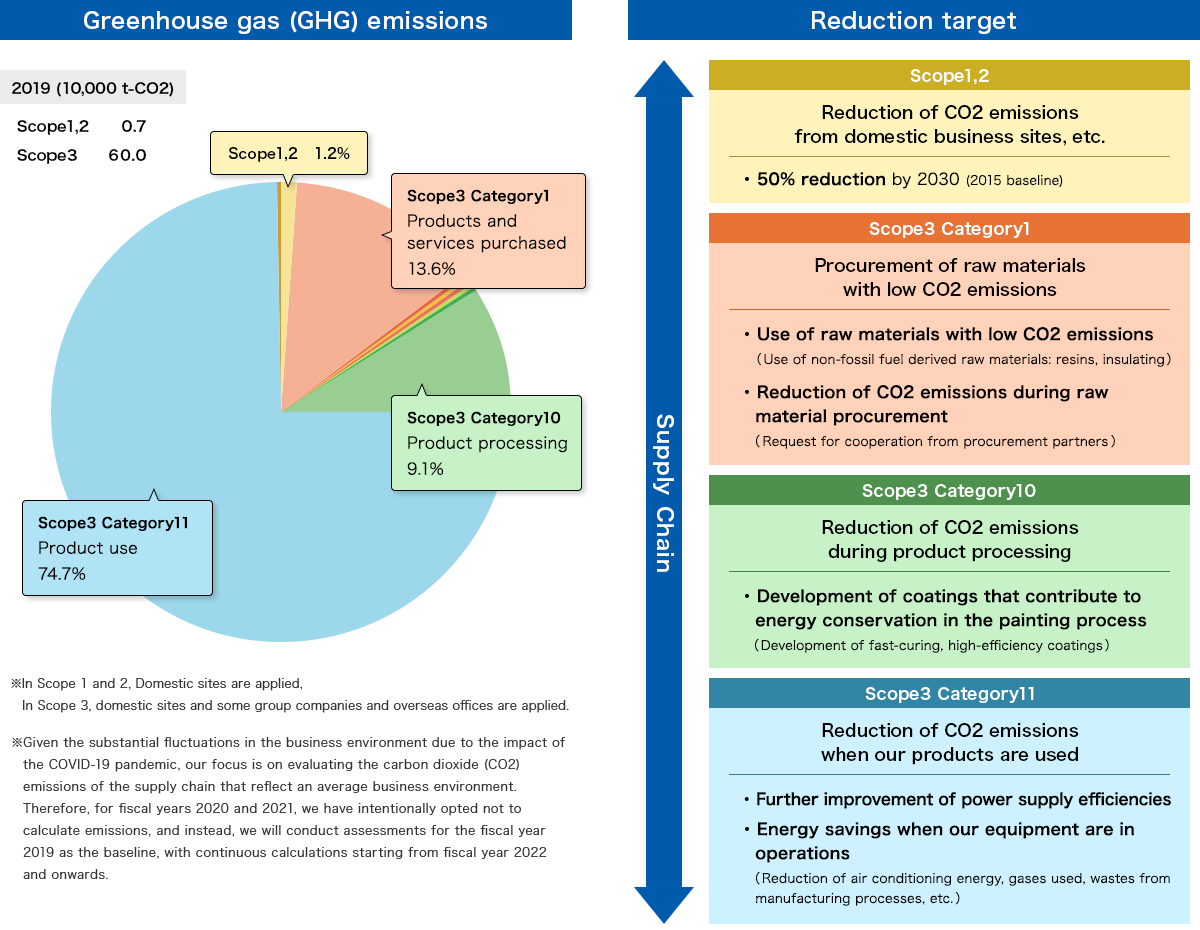
Working Toward Carbon Neutrality
Our group set a goal in 2021 to contribute towards achieving carbon neutrality by 2050. We aim to reduce our own (domestic facilities) CO2 emissions by 50% by 2030, using that of 2015 as the baseline, also work on reducing CO2 emissions throughout our supply chain. Furthermore, we are exploring alternative proposals for functional mechanism components as part of our broader commitment to reducing CO2 emissions across society.
We have been actively working on reducing our own CO2 emissions over the past few years, thanks to the implementation of energy-efficient equipment and other measures. Furthermore, factors such as the impact of the COVID-19 pandemic on our operations and the suspension of our clean room at the Mamada factory have also contributed to these consistent annual reductions.
Moving forward, we will continue to explore initiatives such as the adoption of renewable energy sources to achieve even further reductions.
Trial for Climate Change
We see climate change not only as an opportunity to address our business risks, but also as a turning point to enhance the value of our products and services as well as our corporate value. Since the increase in average temperatures due to climate change will have a significant impact on society, we have assumed the scenario of limiting the temperature increase to less than 1.5°C to 2.0°C as presented by the IEA (International Energy Agency) and IPCC (Intergovernmental Panel on Climate Change) and assessed the risks and opportunities affecting our business activities qualitatively with reference to the recommendations of the TCFD. The Sustainability Executive Committee is discussing and compiling measures to reduce risks and expand opportunities. These measures will be reflected in business plans and other documents.

Key business risks and opportunities also solutions for climate change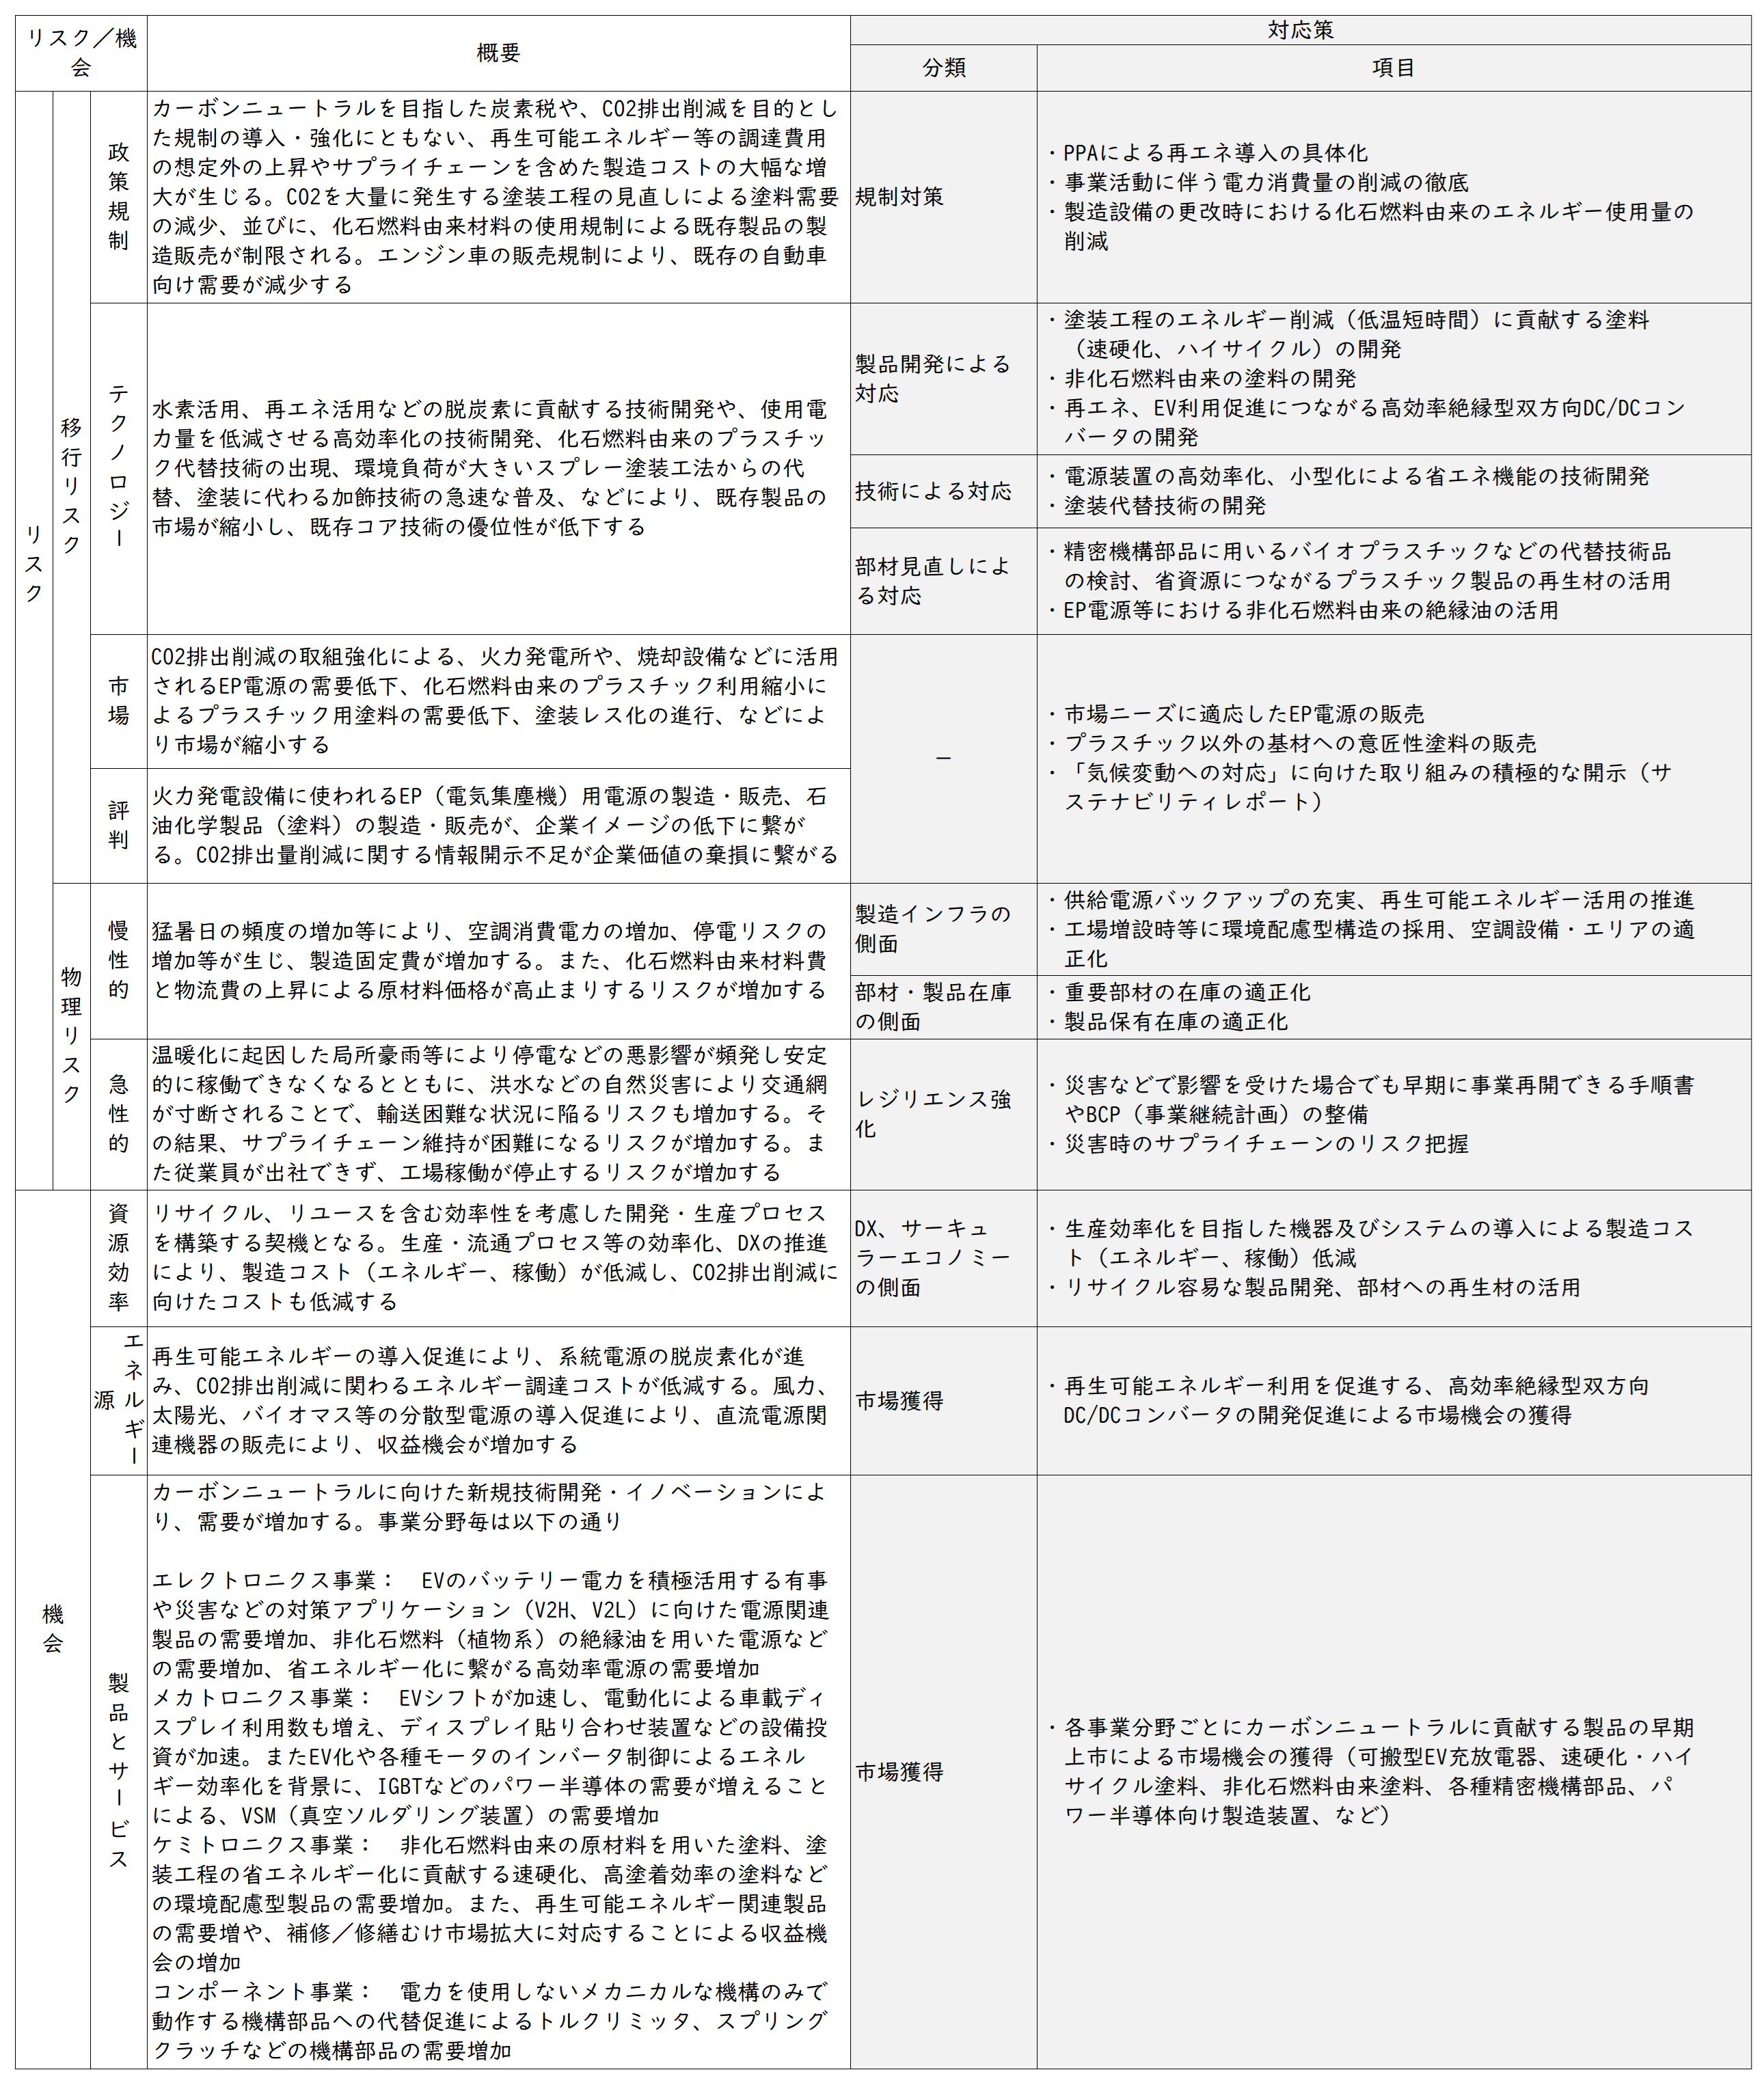
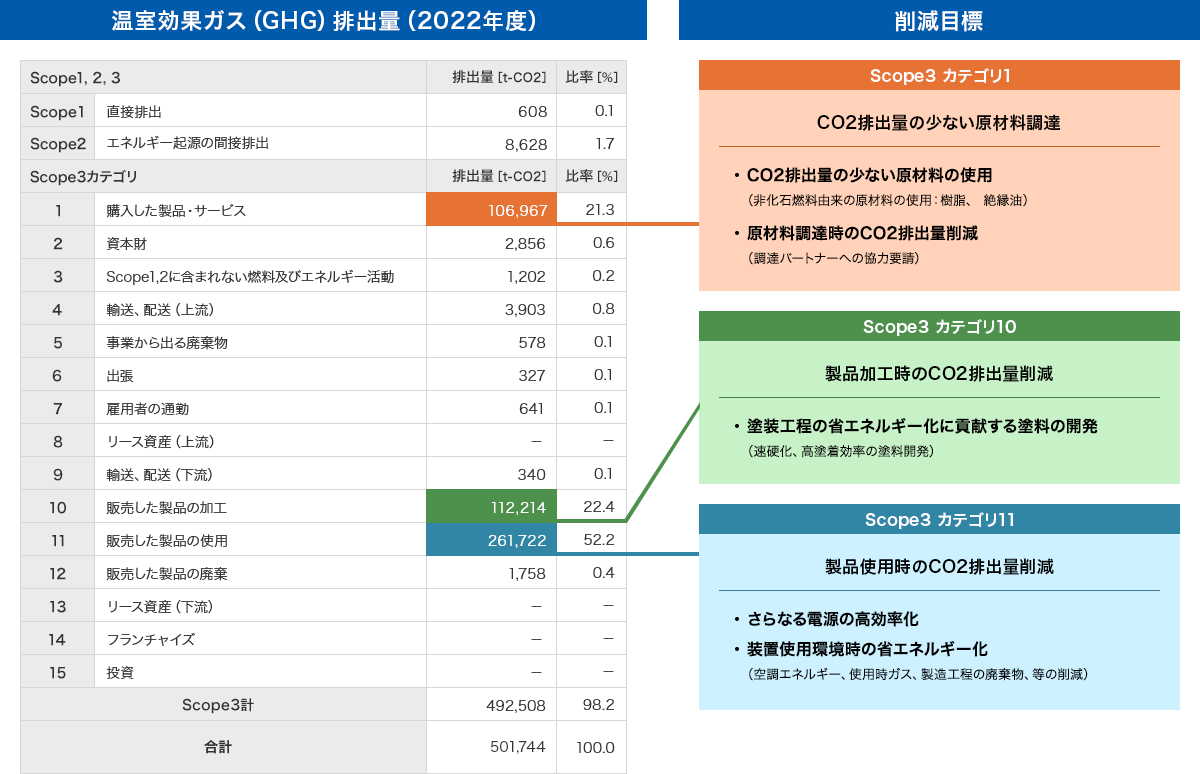
Greenhouse gas (GHG) emissions calculation and reduction targets throughout the supply chain
In 2022, we established and publicly disclosed targets for each significant Scope 3 category in terms of impact. Moving forward, we will continue to engage in the development of new technologies and products, while also requesting cooperation from our procurement partners in reducing CO2 emissions.
Fiscal Year 2019 Greenhouse gas(GHG)emissions
Environmental Data
| Environmental Performance | coverage | FY2020 | FY2021 | FY2022 | FY2023 | FY2024 |
|---|---|---|---|---|---|---|
| Electricity consumption [kWh] | Domestic | 1,290 | 1,145 | 1,136 | 1,088 | 1,108 |
| Waste emissions [t] | Domestic | 677 | 625 | 653 | 676 | 578 |
| Waste plastic [t] | Domestic | ー | ー | 44 | 50 | 54 |
| Water consumption [m3] | Domestic | 123,870 | 60,317 | 49,877 | 46,074 | 47,886 |
| coverage | FY2015 | FY2021 | FY2022 | FY2023 | FY2024 | |
| Energy-derived carbon dioxide (CO2) emissions [t] | Domestic | 10,106 | 6,084 | 5,996 | 5,717 | 5,397 |
| Greenhouse gases | coverage | FY2019 | FY2020 FY2021 |
FY2022 | FY2023 | FY2024 |
| GHG [t-CO2] | Group | 600,077 | ー | 501,744 | 523,209 | 503,388 |
| Scope1 | Group | 695 | ー | 608 | 877 | 823 |
| Scope2 | Group | 6,904 | ー | 8,628 | 7,872 | 6,552 |
| Scope3 | Group | 592,478 | ー | 492,508 | 514,461 | 496,012 |
| 1.Purchased goods and services | 81,372 | ー | 106,967 | 100,296 | 96,372 | |
| 2.Capital goods | 2,609 | ー | 2,856 | 2,792 | 5,411 | |
|
3.Fuel- and energy-related activities (not included in scope 1 or scope 2)
|
1,129 | ー | 1,202 | 1,253 | 1,237 | |
| 4.Upstream transportation and distribution | 2,458 | ー | 3,903 | 7,340 | 7,897 | |
| 5.Waste generated in operations | 384 | ー | 578 | 831 | 849 | |
| 6.Business travel | 1,290 | ー | 327 | 620 | 444 | |
| 7.Employee commuting | 378 | ー | 641 | 705 | 805 | |
| 8.Upstream leased assets | ー | ー | ー | ー | ー | |
| 9.Downstream transportation and distribution | 81 | ー | 340 | 529 | 524 | |
| 10.Processing of sold products | 54,733 | ー | 112,214 | 121,514 | 119,845 | |
| 11.Use of sold products | 447,614 | ー | 261,722 | 276,700 | 260,853 | |
| 12.End-of-life treatment of sold products | 430 | ー | 1,758 | 1,880 | 1,775 | |
| 13.Downstream leased assets | ー | ー | ー | ー | ー | |
| 14.Franchises | ー | ー | ー | ー | ー | |
| 15.Investments | ー | ー | ー | ー | ー |
※Greenhouse gas data coverage contains the Origin Group (including the Company, its subsidiaries and local affiliates related to the Company's supply chain).
※Greenhouse gas calculation data represents fluctuations due to the review and refinement of areas and calculation methods on a case-by-case basis.